Summary
Key findings from the lab results behind this site:
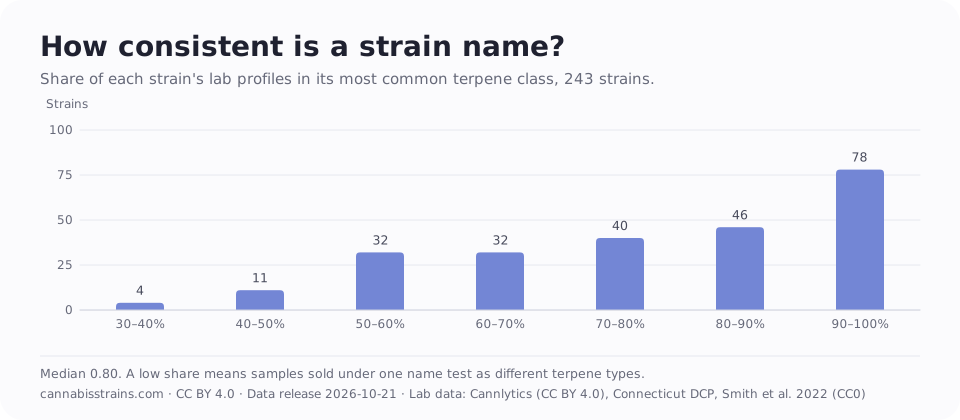
- Most strain names are fairly consistent, but not all. Across 243 strains with graded terpene profiles, the median strain has 80% of its profiles in one chemovar group; 78 strains reach 90% or more, and 47 fall under 60%.
- One of three terpenes leads most profiles. Myrcene leads 35% of 243 strain profiles, caryophyllene 31.3% and limonene 26.7% (results from 2013–2026).
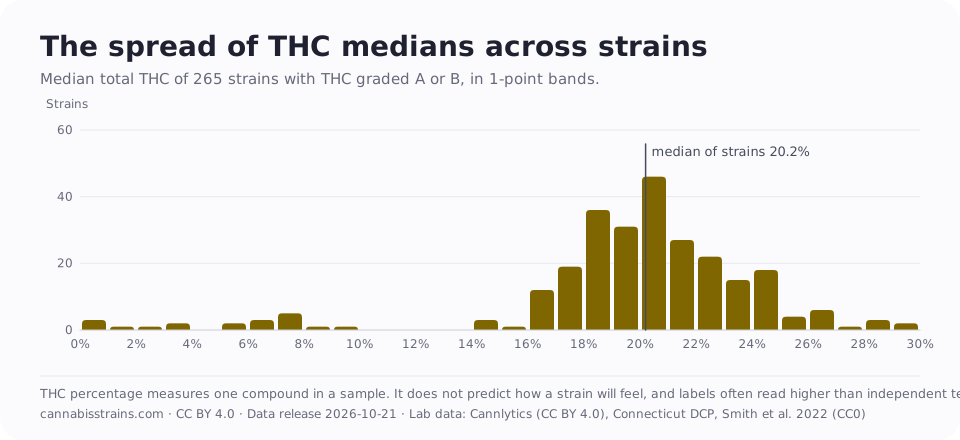
- The middle of the THC range is narrower than strain lists suggest. Half of the 265 strains with THC graded A or B have a median total THC between 18.5% and 22.1%.
- Lab THC by test year. The median total THC of flower results went from 10.3% in 2017 (n = 58) to 25.4% in 2026 (n = 419), while the states and labs in the data changed too.
- Some reported totals don’t add up. In one state’s public data, 1,574 of 5,197 rows (30.3%) carry a total THC more than one point away from Δ9-THC + 0.877 × THCA.
1. How consistent is a strain name?
Question. When flower is sold under the same name, how often does it share the same terpene pattern?
Measure. For each strain, the share of its lab profiles that fall in its most common chemovar group. Strains with terpene profiles graded A to C; the most and least consistent lists use strains with at least 30 terpene profiles.
Figures. Median consistency 80% across 243 strains. Most consistent: Apple Fritter (100%, n = 310 profiles). Least consistent: Trainwreck (35%, n = 144 profiles).
A published study of about 90,000 US lab samples found the same pattern: some names are far more consistent than others. A name on a label is a claim about genetics, not a measurement of it.
2. Which terpene leads?
Measure. The lead (largest) terpene in each profile, counting only terpenes on that lab’s panel.
Figures. Myrcene 35%, caryophyllene 31.3%, limonene 26.7%, terpinolene 4.1%, pinene 1.6%, linalool 1.2% (share of 243 strain profiles built from 46,250 lab terpene profiles, 2013–2026).
Three groups cover most profiles: caryophyllene with limonene, myrcene with pinene, and terpinolene with myrcene. Terpene panels differ between labs, so a terpene a lab didn’t test is left out, not counted as zero.

3. How much does THC vary across strains?
Measure. The spread of strain medians for total THC, strains with THC graded A or B.
Figures. Middle half of strain medians: 18.5–22.1% (n = 265 strains). Within a typical strain, the middle half of its own results spans 5.2 points.
Differences between strains are often smaller than differences between batches of the same strain. THC percentage measures one compound in a sample. It does not predict how a strain will feel, and labels often read higher than independent tests.
4. Lab THC by test year
Measure. Median total THC of flower results by test year, with n per year.
Figures. 2017: 10.3% (n = 58); 2018: 17% (n = 1,298); 2019: 20.2% (n = 1,551); 2020: 20.7% (n = 8,283); 2021: 21.2% (n = 14,657); 2022: 21.6% (n = 20,102); 2023: 23% (n = 7,869); 2024: 20.7% (n = 197); 2025: 25.1% (n = 334); 2026: 25.4% (n = 419).
Caveat. The states, labs and products in public datasets change from year to year, so a change in this chart may reflect who was testing, not a change in the plants.

5. When reported totals don't add up
Measure. Rows in one state’s public data where the dataset’s own total THC differs from Δ9-THC + 0.877 × THCA by more than one percentage point.
Figures. 1,574 of 5,197 rows (30.3%) in Washington’s public lab data. In the other datasets we checked, no row differs by more than a point.
We recompute total THC from Δ9-THC and THCA for every result we use, so our figures don’t depend on how a dataset totaled them. No lab or producer is named. Try the total THC calculator.
6. Same name, different chemistry
Measure. Strains whose results split between two or more chemovar groups, with no group holding half of their profiles.
Figures. 15 of 243 strains with graded profiles.
This is why each strain page shows how many results stand behind its profile.
Method
All figures come from release 2026-10-21 of our pipeline (method version 1.0.0). Flower and pre-rolls only. Total THC is computed by us. No lab or producer above 30% of a strain’s weight, a top 1% trim for strains with 100 or more THC results, and grades A to D per figure. Full detail: sources and grading.
Data and reuse
The figures and charts in this report are CC BY 4.0. Download them, and the strain-level data, from /data/. Credit “CannabisStrains.com Strain Chemistry Report 2026” with a link to this page.
CannabisStrains.com (2026). Strain chemistry report 2026, release 2026-10-21. https://cannabisstrains.com/reports/strain-chemistry-2026/ (accessed October 21, 2026).
Sources
- The phytochemical diversity of commercial Cannabis in the United States (Smith, Vergara, Keegan and Jikomes), PLOS ONE 17(5): e0267498. Public Library of Science.
- Methodology and data pipeline (method version 1.0.0). CannabisStrains.com.