Downloads
Release 2026-10-21, updated October 21, 2026, 307 strains. Each link carries the release id, so older versions stay available.
| File | What it holds | Size |
|---|---|---|
| strains.csv | One row per strain: name, plate number, total THC, CBD and minor cannabinoid ranges (middle half), medians, n, grades and years; chemovar; chemotype | 100 KB |
| strain-terpenes.csv | One row per strain and terpene: median share of total terpenes, n and grade | 84 KB |
| strains.json | The same as the two CSVs, nested per strain | 234 KB |
| terpenes.csv | Summaries across strains for each terpene (each strain counted once) | 1 KB |
| cannabinoids.csv | Summaries across strains for each cannabinoid | 0 KB |
| sources.csv | The datasets the figures come from | 2 KB |
| dictionary.csv | Every column: name, type, unit and meaning | 8 KB |
| README.md | What the files hold and how the figures are made | 4 KB |
| LICENSE.md | The licence text (CC BY 4.0) | 1 KB |
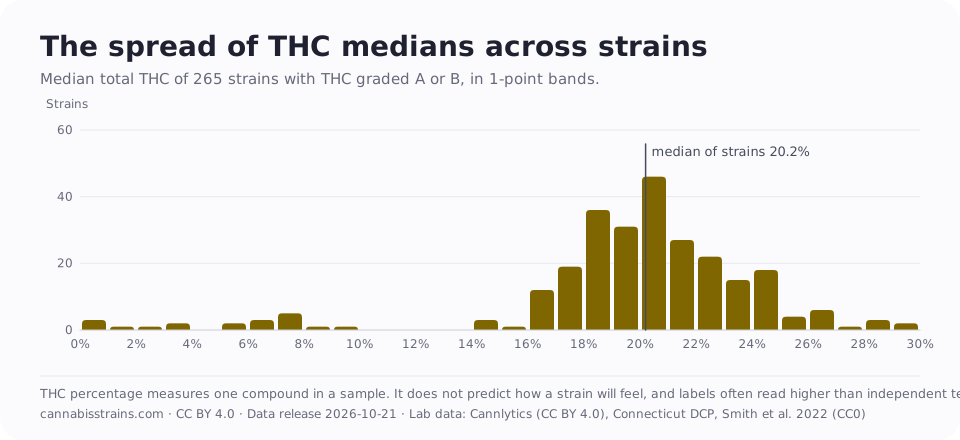
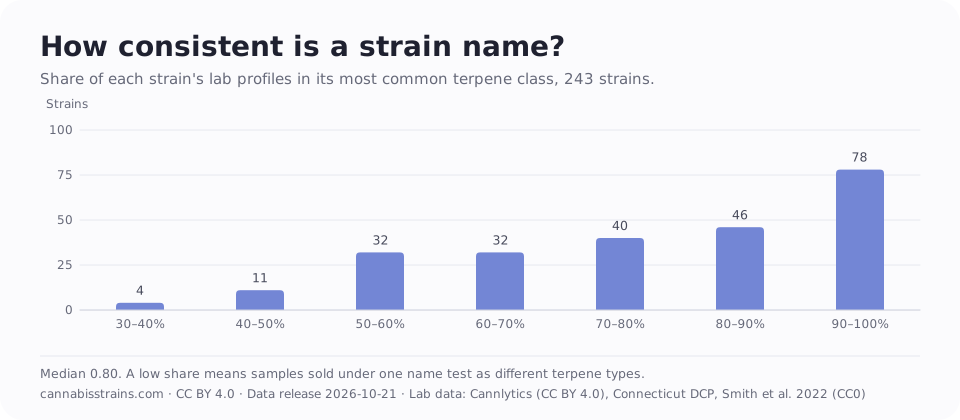
| charts/*.svg | The terpene chart, the cannabinoid chart, the strain map and the report charts | 7 files |
What's in it, and what isn't
- In: per-strain aggregates (ranges, medians, counts, grades, years), terpene shares, chemovar and chemotype, and the release and method version.
- Not in: individual lab results, lab or producer names, product names, or anything about effects. Individual results are in the upstream datasets credited below.
- Grade D figures are blank, not zero. A blank means fewer than three results, so we don’t publish a number.
- Units: cannabinoids are % of dry weight as reported by the labs; total THC is Δ9-THC + 0.877 × THCA (and the same for CBD; CBG uses 0.878), computed by us. Terpene shares are % of the total measured terpenes, counting only terpenes on that lab’s panel.
Licence
Our data and chart images are released under the Creative Commons Attribution 4.0 International licence (CC BY 4.0). You can copy, share, adapt and use them, including commercially, as long as you give credit.
Credit “CannabisStrains.com” with a link to https://cannabisstrains.com/data/, name the release you used, and keep the upstream credits that come with the files. A line like this is enough:
The strain illustrations are not part of the open licence. Every strain illustration on this site is original artwork, all rights reserved. To license the art, contact us.
The licence covers our aggregates and charts only. It doesn’t give you any rights in the upstream datasets beyond their own licences, and it doesn’t cover trademarks in strain names.
Data: CannabisStrains.com, release 2026-10-21, https://cannabisstrains.com/data/ (CC BY 4.0). Includes lab results from Cannlytics (CC BY 4.0), the Connecticut Department of Consumer Protection, and Smith et al. 2022 (CC0).
Upstream credits
Our figures are computed from these public datasets. Each keeps its own licence:
- Cannlytics, cannabis_results (Maryland, Michigan, Nevada and Washington public records): Lab results from Cannlytics, cannabis_results (https://huggingface.co/datasets/cannlytics/cannabis_results), CC BY 4.0 (https://creativecommons.org/licenses/by/4.0/). Filtered to flower, re-totalled and aggregated by CannabisStrains.
- Connecticut Cannabis Product Registry: Dept. of Consumer Protection Drug Control Division. Public domain.
- Smith et al. 2022: Smith CJ, Vergara D, Keegan B, Jikomes N (2022) The phytochemical diversity of commercial Cannabis in the United States. PLOS ONE 17(5): e0267498. Data CC0 1.0; article CC BY 4.0.
The full credit text for each release is in its ATTRIBUTION.md and on our sources page. Our figures are our own aggregates. They don’t represent the views of any data provider, and no lab or producer is named in them.
How to cite
CannabisStrains.com (2026). Strain-level cannabis lab aggregates, release 2026-10-21. https://cannabisstrains.com/data/ (accessed October 21, 2026).
Changes and corrections
Each release has a changelog listing added, removed and changed figures. If you find an error, tell us and we’ll fix it in the next release and note it in the changelog.